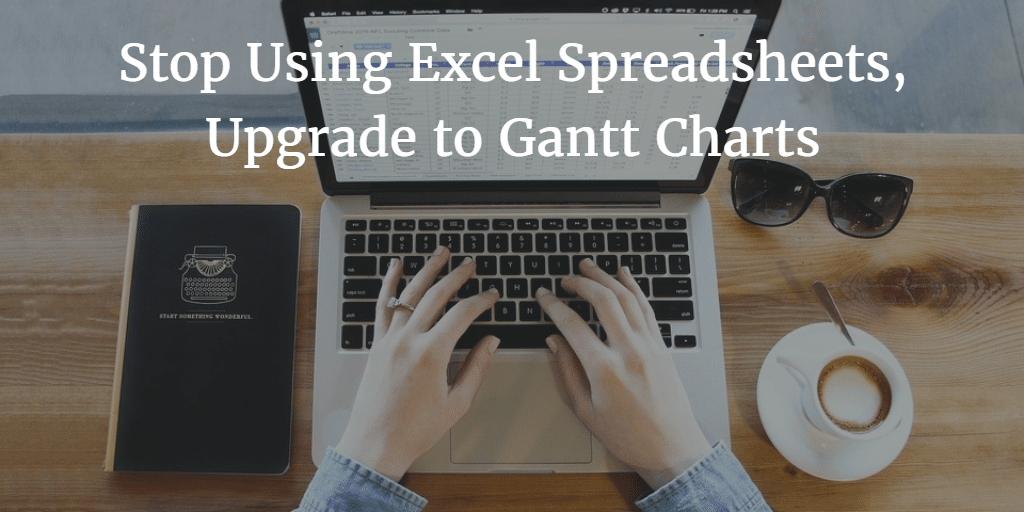
Introduction to Spreadsheets & Gantt Charts
Both spreadsheets and Gantt charts are commonly used as project management tools for displaying activities against time. You can also use them to spot duplications, and bottlenecks and for collaboration with other stakeholders. These tools give them the chance to quickly get a good impression of the structure of your project. The charts and sheets usually reflect activities on the left side against time scale at the top. These tools are designed to present the project activities using a bar in which the length and position of the bar reflect duration from the start period. The Gantt charts help establish the number of activities, their start and end dates, overlapping activities, and progress.
Gantt Charts 101
A Gantt chart tool is a visual representation of the flow and structure of a project from start to completion. The Gantt chart was invented by the Polish engineer Adamiecki in the 1890s and would later be improved upon by American engineer Henry Gantt. It provides a visual impression of each activity with the timelines. The timelines appear at the top while rows appear at the bottom. The rows contain coloured bars that mark the start and end date of each phase of the project. This is a great tool for quick and detailed review of the flow of your projects at any point in time. This tool will help you to break the project down into manageable chunks and invent the most logical order with which to execute the phases.
Getting Started With Gantt Charts
Once you’ve gained a proficiency level understanding of Gantt charts, you can then be able to utilize its features effectively. Making Gantt charts for your project can be done in five easy steps.
Step I. Build/Choose a Template. There are hundreds of Gantt chart templates online which you can start with. On the other hand, you can build your own Gantt chart from scratch and make it suit your variables. Templates can be hived from past projects or chosen from the hundreds of project management software around. The best part about building your template from scratch is that it becomes easier to take advantage of best repeatable practices from previous project management activities. The template will provide information on the repeatable tasks as well as sequencing.
Step II. Mark Your Milestones. The software platforms for creating Gantt charts also have a feature for embedding milestones. This is simply a marker that indicates the phases of the project and when they got completed. It’s up to you to choose the markers and integrate that feature into the Gantt chart that you prefer to use. Listing your milestones helps to break down the project into manageable and trackable phases. These phases are easier to conceptualize, measure, and alter during the execution. Having the milestones in the system enables the stakeholders to keep track of how the project is progressing without getting lost in the details.
III. Add Tasks, Sequence, and Create Dependencies. At this point, you can source for actual data, perspectives, and facts from the managers and operational teams that will handle specific phases. Let them furnish you with all the reports needed to generate proper records. These reports should include, the number of workers, the financial projections, time scales, any anticipated challenges and the acceptable margins. Lots of multiple tasks can be performed simultaneously though not by the same teams. You should be able to assign these roles in such a way that they run concurrently to save time. The third and last bit in this segment are mapping dependencies. Never remove a dependency until you are sure it’s okay to do so. That’s because getting them back after the termination can be tough and can create a long chain of events with costly consequences.
IV. List Your Resources. Planning your project on the Gantt chart is one thing, executing the proposed project is a whole different reality. The most critical resource any project manager has is the people, followed by time. You have to optimize these two if you are to complete your projects efficiently and on time. Just because you have particular tasks doesn’t mean there is someone in the team free to do it. You have to match skill-sets, availability of personnel, time scope and the duration of each task. You can have built-in features that do not allow for double booking of specific resources and duplicating of tasks. The Gantt chart should inform you which resources are needed where and what the consequences of overbooking or duplication are, on the rest of the project schedule.
V. Collaborate All The Variables. Make sure your projections mirror reality as much as possible. This reduces the number of adjustments you have to make along the way. The best way to minimize shocks from the adjustment is to collaborate as much of the project phases and resources as possible. Remember that a Gantt tool is just part of a larger project management work collaboration software. Everyone involved in the project should have access to the chart and also be able to make recommendations on the issues that affect their segment of the project. Such an arrangement also ensures that if a signee has finished a certain phase early, they can update on the project so that those in charge of the next phase can begin their work. The value of the Gantt chart shines when it’s to be collaborative, and there are robust checks built in. Through this, the tool is more likely to reflect reality.
Gantt Charts Vs Spreadsheets
Lots of project management experts are ditching spreadsheets for Gantt charts due to their unreliability and quality issues. There are a number of drawbacks that are pushing away these engineers and project managers.
I. Clunky Spreadsheets: Most Excel spreadsheets can prove to be excessively large and unsightly to work with. Trying to make it smaller or more appealing will push the limits of what Excel is designed to do. When working with large organizations or major projects the amount of data will simply overwhelm the spreadsheets. This, in turn, hinders coordination, decision making, record keeping, and workflow. That’s why it’s far easier to shift to Gantt
II. Spreadsheets are static. Your spreadsheet data is only as accurate as your most recent entry even if that entry was three months ago. This makes it hard to derive quick solutions from the data. Spreadsheets aren’t designed with the capability to have real-time data automatically entered into your documents. You may, in turn, use Google sheets and Dropbox but these are simply storage devices, not one-stop shop repositories for all your project content.
III. Lower Data Integrity: A study by Tuck School of Business found out that as much as 94% of project spreadsheets have manual errors. Human error is the biggest drawback to working efficiently with spreadsheets. Excel’s flexibility is its strength, but it’s also restraining weakness. It is even harder to detect these errors unless two to three people do a manual run through. That becomes tough, especially when dealing with huge volumes of data. That’s why it’s simply easier to shift to Gantt.
IV. Double Data Entry. Most companies end up doing repetitive work by capturing the data in the field than having to transfer it manually into spreadsheets. This consumes time, staff-hours and cash. It also amplifies the possibilities of human errors in the data entry. In fact, this accounts for the huge number of errors found in most spreadsheets data. Capturing and entering the same data in spreadsheets within an organization is counterproductive and inefficient, to say the least.
V. Data Accountability. It’s very simple to delete, alter and destroy data in an excel spreadsheet sheet. This is why you need a project management solution that has greater accountability and corporate diligence. A proper solution should enable you to see what and when was it altered, who altered it and how. You should also able to retrieve any lost data in case of any errors that occur along the way.
5 Reasons to Use Gantt Charts
Thousands of firms globally rely on Gantt charts to monitor their projects and resources. A Gantt chart improves productivity, track results, improves communication, increase coordination and saves time and resources. Below are five key reasons Gantt charts are often advantageous:
I. Avoid Confusion. This solution was designed to keep users on track while giving them a visual timeline from the beginning to the end of specific tasks. The visual scaling provides a more logical and memorable method of tracking timescale-based tasks. This makes it possible to provide precise data on each deliverable on a daily, weekly, monthly or yearly basis. This is very critical if you want to minimize or eliminate confusion especially when you are handling multiple items and concerns at the same time. Confusion could cost you time, money and create lots of unnecessary conflicts which slows down project progress.
II. Keep Everyone Updated. Gantt allows anyone with access to get an overview of the projects, their duration, progress and future plans. This minimizes the possibility of misunderstanding. It also allows everyone to provide input on the developments and the overall quality of the work in progress. This is especially critical for stakeholders who aren’t directly involved in the day to day operations of the project. They are able to get a clear picture and data needed for decision making on their part. This allows the various teams to set mutually understood goals, and conduct their efforts according to the set protocol.
III. Understand Task Relationships. Being able to map out interrelationships is very critical when it comes to assigning time and resources to various aspects of the projects. A manager can simply figure out which segment will take more resources and easily compute the differences in resource allocation. Besides that, he will be able to understand the timings so that he can begin activating the next phase of a project once the previous phase starts to draw down. This sequential understanding of a project’s variables save time, money and ensures smooth transitions during project management.
IV. Effect Conflict Resolution Mechanism. In any project management, there will be conditions, misunderstandings, and conflict. That’s why as the leader you’ll need to be able to anticipate some of these conflicts beforehand. A simple simulation of the project and various appraisals will enable you to anticipate any significant challenge along the way. With that in mind, you are able to solve the crisis before they happen or expect them and deal with them as they occur. Not only do you save time, but you’ll also be able to reduce friction between project teams and minimize loss of time used in trying to reconcile warring parties or competing phases of the project.
V. It Enhances Communication. Your ability to keep the resources utilized optimally lies in the Gantt tool’s capacity to properly communicate to all the stakeholders in the project. You need the data availed by Gantt to be able to assign tasks, manage resources, temper expectations, motivate the team and inform others of the timelines and the schedules. Communication is such a central and core function of project management. Ability to relay information back and forth determines the pace of execution and capacity to stick to the timelines drawn on the Gantt solution. Hence, a Gantt chart can play a vital role in closing the gap between management, investors, and operations.
VI. Documenting Best Practices. Project management is often full of repetitive actions that can be systemized. Using Gantt charts to visualize and track the project schedules over time produces repetitive styles that can incorporate and document best practices. Recording these repetitive tasks makes it easy for you to transition tasks to incoming teams and transfer these documented practices to multiple project management tasks. Gantt charts are highly intuitive and can avail to you these repetitive formats that make scheduling workers and tasks rather easy. Through this, Gantt charts increase organizational efficiency and can make a valid contribution to knowledge management.
What about Gantt Chart Limitations?
For all its great attributes, Gantt charts were designed to cure all project management scheduling problems. There are situations in which other types of tools like google sheets may prove to be more efficient. This is particularly the case in areas where a specific milestone or critical task is missing or misreported because the project manager didn’t practice due diligence. Some of its other major limitation includes its inability to factor certain constraints like costs, time and scope of the project. Even then, Gantt chart’s advantages have been optimized for all types of organizations for the requisite applications.
The Best Drawing Tools for Gantt Charts
One of the major objections by those who shun Gantt charts is that the tool lacks drawing tools. Lots of drawing tools and packages have expensive project management tools which are not suitable for simple Gantt charts. One effective drawing tool that works for Gantt charts is Creately which makes it very easy to draw Gantt charts by providing you with the templates as well as simple drag and drop interfaces. Creately is intuitive and feature-rich web-based software that details a project schedule or a sequence of events timeline which in turn simplifies chart creation, collaboration, and completion in short order.
Why Leankor Gantt Chart Tool
Most project management operators and management are moving towards having a visual tracking of the workflow as companies strive for greater agility. That is why our visual workflow tool is such a critical part of project management work for people worldwide. It’s built on the best platform in the world i.e. Salesforce, and it significantly improves project management methodology, decision making, overall collaboration, and delivering on customer value. Every year thousands of managers rely on the features of Leankor project management tool to efficiently execute their plans and programs with the least resources possible.
I. Built For Agility. The essence of relying on project management tools is to be able to track the projects and the implementation of each phase visually. Leankor gives you a real-time visibility of workflow which in turn enables you to make quicker decisions. This tool’s ability to utilize Gantt charts and to be able to alter the data sets to generate different outcomes flexible is remarkable. The system is built to adopt newer data and create critical decision-making metrics without the complexity and ambiguity of Excel spreadsheets.
II. Visual Management. Studies show that more than 65% of workers perform visual work using machines that have screens or screen pads. Therefore our invention is predicated on providing workers who handle project management work with a visually effective tool. Leankor places as much emphasis on visual aesthetics and user-friendliness as it does on the technical bits of fitting the data into Gantt charts. This visual management translates to clear, well detailed and easy to follow Gantt charts that are accurately and clearly marked and calibrated.
III. Mixed Modal Methodology. Projects have between 5 to ten teams working on various aspects and phases at any given time. This necessitates the need for constant communication, information sharing and benchmarking. Embedded into Leankor are the features required to enable different teams to interact and coordinate their functions so as to minimize clashes, overlapping, and duplication of efforts. It also allows the managers and operations teams to visually keep track of the work in progress, monitor the implementation and give feedback based on the data generated by the charts.
IV. Real Time Visibility. Unanticipated crisis or conflicts are the costliest mistakes done in the management of a project. While not all problems can be anticipated, timely resolution and handling of challenges and problems could save the directors lots of time and resources. This is predicated on the ability of the critical stakeholders to have real-time access to Gantt chart data and make decisions accordingly. Leankor gives them real-time visibility into project phases and workflows which in turn results in faster decisions. Sometimes the ability to make a quick decision in the nick of time could be the difference between putting out small fires and dealing with a wide scale disaster during project management.
V. Incredible Flexibility. As a project management tool, Leankor allows you to sync current processes without slowing down workflow or productivity. This seamless integration is critical especially when you come into contact with valuable data that will enhance your operation in a continuing program. The best part about working with this tool is that it’s far less technical and you can use the tool without the need for specialized IT skills. The tool has incredible user-friendly features that minimize the bugs and hitches that are often common during such integration.
VI. World Class Platform. One of Leankor’s most critical features is its hosting. The system is built on salesforce.com which has robust security. It’s a reliable platform that allows enterprise scalability. The best part about this feature is that the platform is global and can easily be synced with lots of other features and apps worldwide. This feature gives you great flexibility and cross-platform coordination which impressively raises the efficiency, security, data accountability and overall work design and sustainability for a firm.
Leankors Extra Management Tools
Besides the Gantt chart tool, there are 22 other management tools that Leankor offers to its subscribers. Most of these tools are focused on sharing, transparency, efficiency and collaboration. There are Gantt charts that help you visualize the plan, as well as Kanban board which gives WIP limits, estimates, and color labels. There are tools for workflow automation and others geared towards real-time communication like file sharing and mentions. There are document management tools as well as project dashboards that give reviews, statuses, and progress.
The team at Leankor have always touted their ability to create a one-stop-shop platform that meets all your project management needs. There are workload management tools, whiteboard, program management, time management, charts, risk management, and notifications as well as expense management. The other major tools for your project management needs are files, security, calendar, task list, project templates, single sign-on, integrations/API and most critically mobile apps.