Before you start tackling a new work project, you need to get an overview. This includes the project’s requirements as well as who needs to be involved. A Gantt Chart can function as the first step of your planning process. Once you have a timeline for your project, you can use your Gantt Chart to come up with an estimate of how long the project is going to take. Sometimes setting a realistic completion date is the difference between making a project work or completing it late. Here are a few ways that Gantt Charts are a project manager’s best friend in making a project successful.
A Gantt Chart helps project managers have a solid plan in place.
The key to helping your project be a success is by using a Gantt Chart to plan and execute. The Gantt Chart was developed by an engineering and project management consultant as a way to visually see a project schedule. Gantt style bar charts have been a popular way to manage projects since their invention in 1910.The Gantt Chart is intended to be a visual representation of the project’s schedule. A Gantt Chart lays out a sequence of dependent events. The visual layout gives your team a quick way to see how each team member’s actions are interrelated with each other. You can use the chart to see your team’s progress as proposed deadlines approach.What are the Gantt Chart benefits for managers?
Team managers are uniquely positioned to benefit from Gantt Charts. These charts give you a bird’s eye view of your entire project. A typical problem of project management tools is that they don’t do a great job of tracking sub-tasks. To stay on top of your project, you need to know when things are scheduled and how completing one deliverable will lead into the next step. Losing track of this process can be a real headache for managers.
Even though Gantt Chart usage is popular among project managers, anyone can use a Gantt Chart to make sure that their team’s work gets completed in time. If you want to track the timeline of your project, then a Gantt Chart would likely benefit your project. A good tip is to think about the work that you want your chart to represent before starting your project.
How a Gantt Chart gives project managers superpowers.
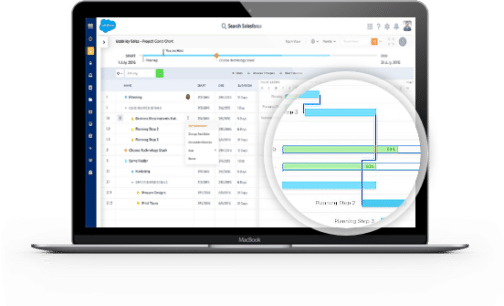
When using Gantt Chart software, you want to make sure that they have the following features to make your life easier.
• Can you update due dates easily if your plan shifts?
• Can you drag and drop things to make changes and move things around easily?
• As parent task estimations are changed, will these changes trickle down to the sub-tasks? With everything being interrelated, it’s important that your Gantt software accurately reflects the relationship between all the parts of your project.
A Gantt Chart helps you stay organized and help keep all your requirements in one place. Let’s say you’re beginning a new project. To get started, you want to capture all the specifications for your project at the outset. This would include all of the workers and their assigned tasks. Each one of these tasks should have a projected time on how long the tasks will take. Once you have those gathered, you can start building your Gantt Chart.
A Gantt Chart display information in a way that’s not really possible with any other project management format. One of the genius touches of these charts is the timeline view. Managers can stay on top of the planning process and reduce the uncertainty inherent with shifting deadlines. The Gantt methodology helps tie your plan together with action steps. This allows you to stay on top of upcoming complications before they become a problem.
A Gantt Chart helps you see which tasks need help. With a Gantt Chart, you should be able to see when tasks are overdue and which workers are falling behind. You don’t want bottlenecks crashing your entire project. If a segment of your project seems to be stalled, maybe that employee is overburdened with too much work. As a project manager, you can decide to allocate more resources to lighten that worker’s load. That means they’ll be able to finish up that segment and not jeopardize your delivery date. Once those tasks are completed, you can get started on the next phase of your project.
Managers who practice using a Gantt paradigm have improved time estimation powers. People who use Gantt charts for planning and execution report being better able to estimate their project’s scope and the time that it will take to complete. Once you get better at estimating the time required to complete each segment of your project, you can determine how many resources it will take to complete any project. Over time, your powers of estimation will help your business run even more efficiently.
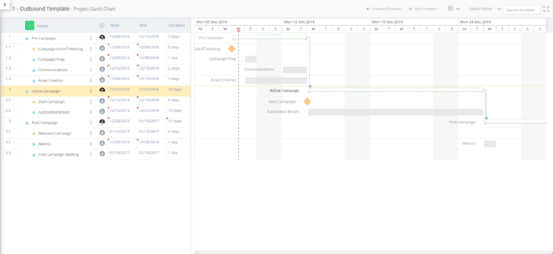
A Gantt Chart can bring together disparate information in one location. Centralizing project information in a Gantt Chart helps you share information among different team members. This allows workers in various departments to stay up to date with project changes. If you have remote workers, it can help if you choose Gantt Chart software that is also available in the cloud. This makes it easier for everyone to be working from the same playbook. When all your major players are in sync, this allows your employees to work more efficiently. And if your Gantt information is displayed publicly, it helps individual stay on top of their own work. Team members can hold each other accountable, which is especially easy if your software also has communication tools built in.
A Gantt Chart is flexible. A Gantt Chart is not something that’s written in stone. A Gantt paradigm is best used as structure from which you can deviate as needed. This is like a roadmap that you’re going to need to edit along the way. A Gantt Chart needs to be updated regularly as your team progresses. In this way, a Gantt Chart can help your organization adapt quickly as things change.
The use of a Gantt Chart can help you plan any type of extensive campaign. A Gantt Chart helps you see the entire roadmap, allowing you to catch any bottlenecks and roadblocks as they appear. As a manager with a complete overview of your project, you’ll be able to adapt quickly to changes as needed. By regularly practicing Gantt concepts, you’ll be able to refine your project estimation process and improve over time. The result of this improved planning is that you’ll have more focused work and less confusion. You’ll be able to reduce errors while clearly establishing realistic expectations with your team and your stakeholders. Projects tend to be more successful when they’re finished on time and on budget.
Get Control Of Your Gantt Chart Super Power Today!
